Weather Reports and Forecasts
Objective
Demonstrate the ability to locate, interpret, and analyze various aviation weather reports and forecasts, correlating this data to identify hazards and make informed go/no-go decisions for IFR operations.
Timing
45 minutes
Format
- iPad weather briefing overview
Overview
- Graphical Forecasts for Aviation
- Terminal Aerodrome Forecasts
- METARs
- Winds / Temperatures Aloft
- Pilot Reports
- Radar Observations
- Surface Analysis Chart
- Freezing Level Chart
- Upper Level Charts
- Significant Weather Prognostic Charts
- SIGMETs, AIRMETs, and Convective SIGMETs
- Recognition of Critical Weather Situations
- Windshear Avoidance
Elements
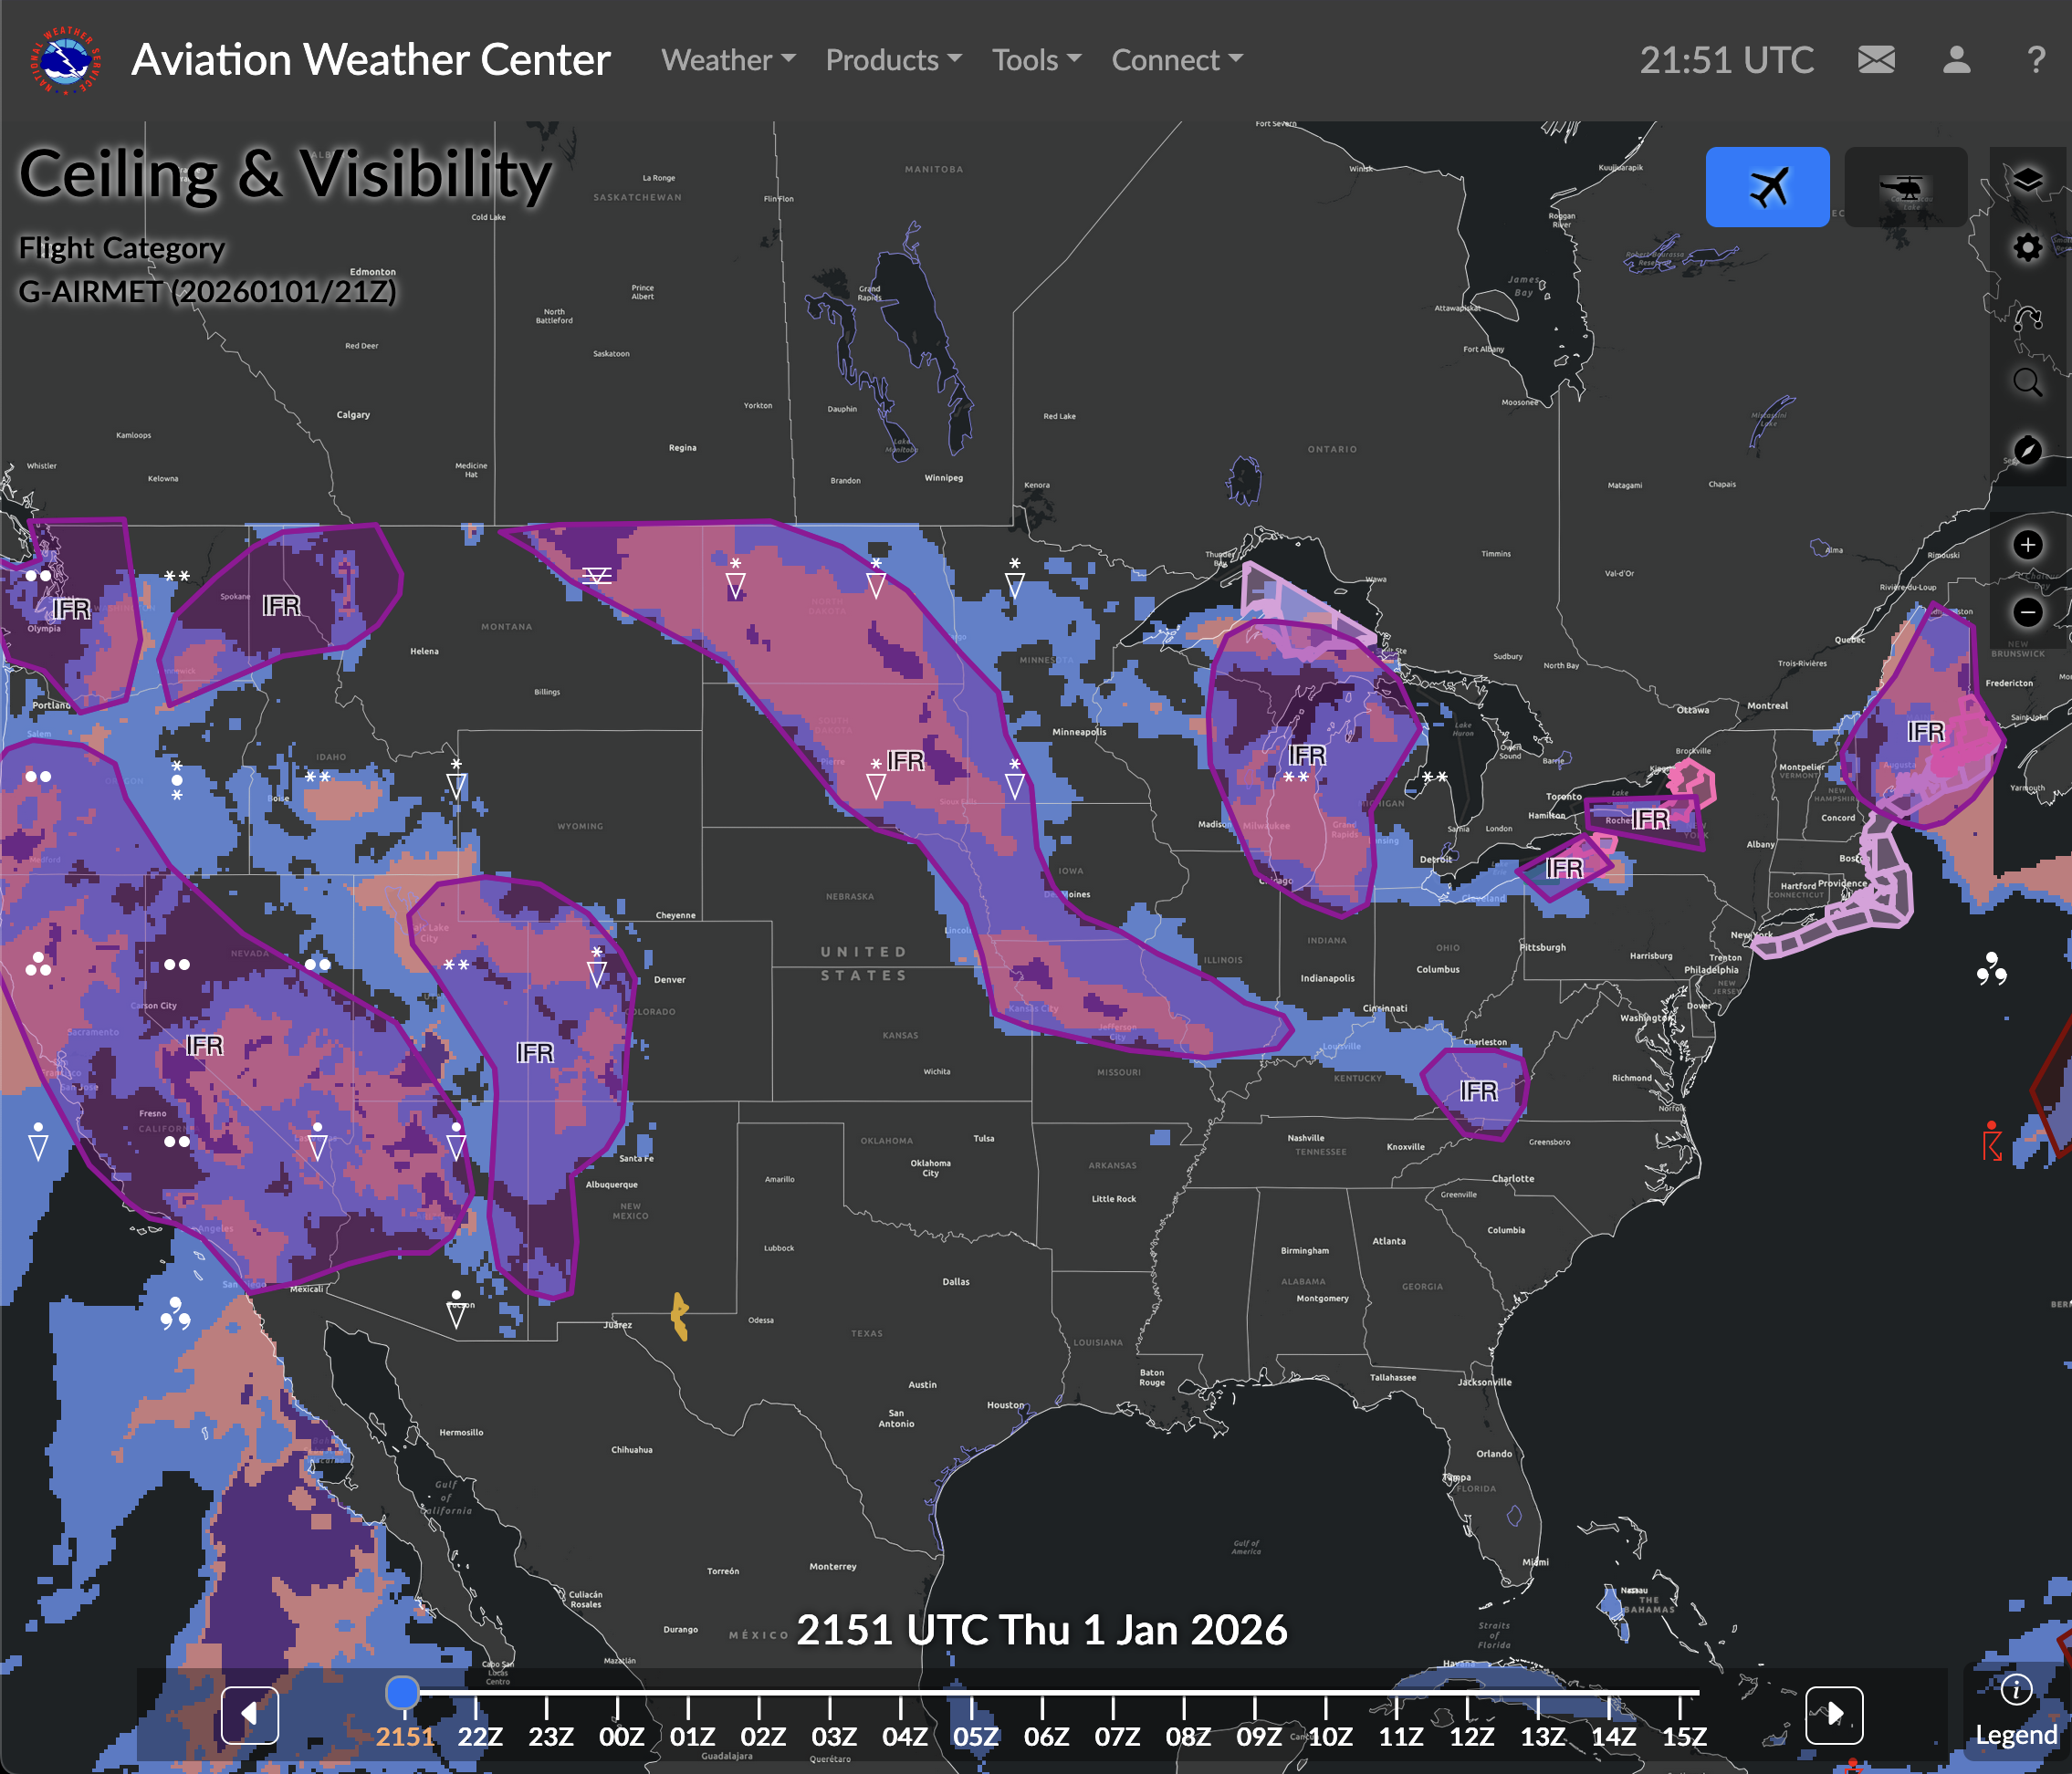
Graphical Forecasts for Aviation
- Web-based interactive tool replacing legacy area forecasts (FA) products for the CONUS
- Covers CONUS, Gulf of Mexico, Caribbean, and portions of the Atlantic and Pacific
- Displays observational data and forecasts from 14 hours past to 15 hours future
- Provides hourly model data for thunderstorms, clouds, flight category, precipitation, icing, and wind
Terminal Aerodrome Forecasts
- Coded statement of expected conditions within the terminal area (5 SM of airport center)
- Standard valid periods are 24 or 30 hours
- Scheduled for issuance 4 times daily at 0000Z, 0600Z, 1200Z, and 1800Z
- Uses FM for rapid changes and TEMPO for temporary fluctuations lasting < 1 hour
- PROB30 indicates a 30% probability of thunderstorms or precipitation
- Only CB cloud types are included in the forecast text
METARs
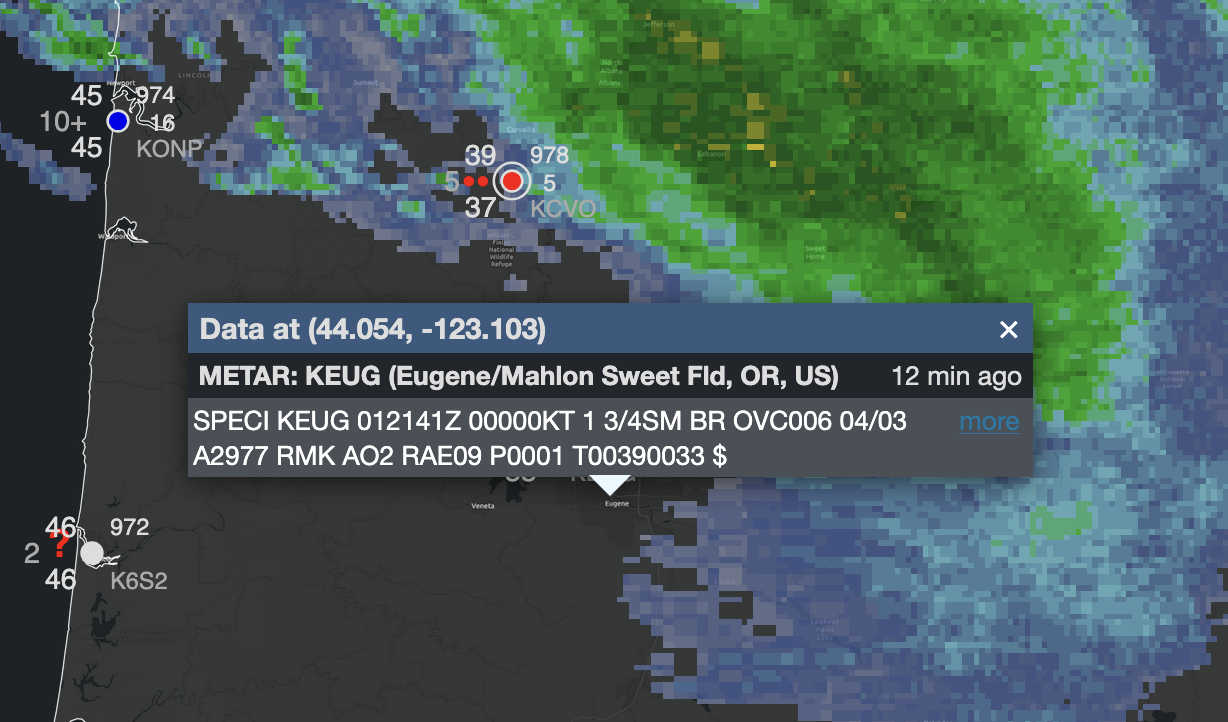
- Routine aviation weather reports transmitted hourly
- SPECI reports issued for significant weather changes between hours
- Standard format includes:
- Type
- Station ID
- Time
- Wind, relative to true north
- Visibility, reported in statute miles
- RVR, if available
- Weather, given in AGL
- Sky Condition
- Temp/Dewpoint
- Altimeter
- Remarks
- Ceiling defined as lowest layer reported as BKN or OVC
- RVR reported when visibility is 1 SM or RVR 6,000 feet
Winds / Temperatures Aloft
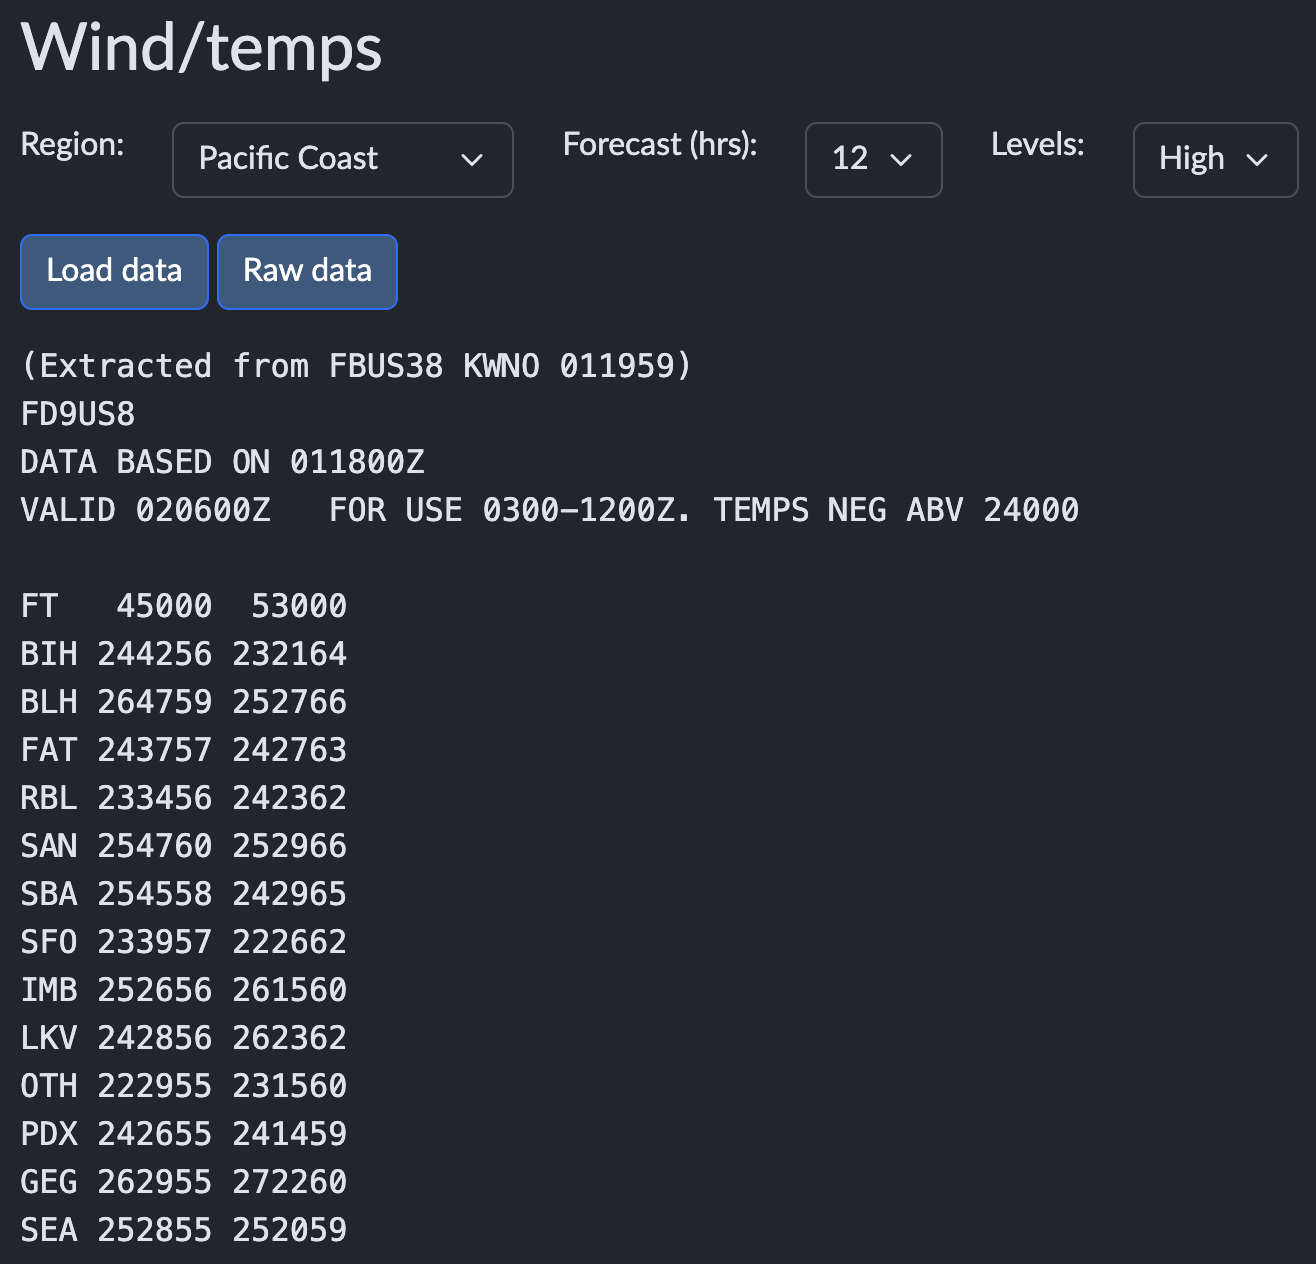
- FB forecasts of wind direction, speed, and temperature
- Direction referenced to true north
- Issued 4 times daily
- Wind speed 100–199 knots: add 50 to direction and subtract 100 from speed
- Temps above 24,000 feet MSL are assumed negative (minus sign omitted)
- Winds not forecast within 1,500 feet of station elevation; temps not forecast within 2,500 feet
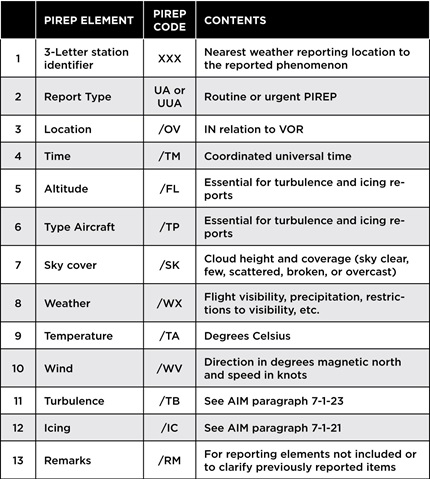
Pilot Reports
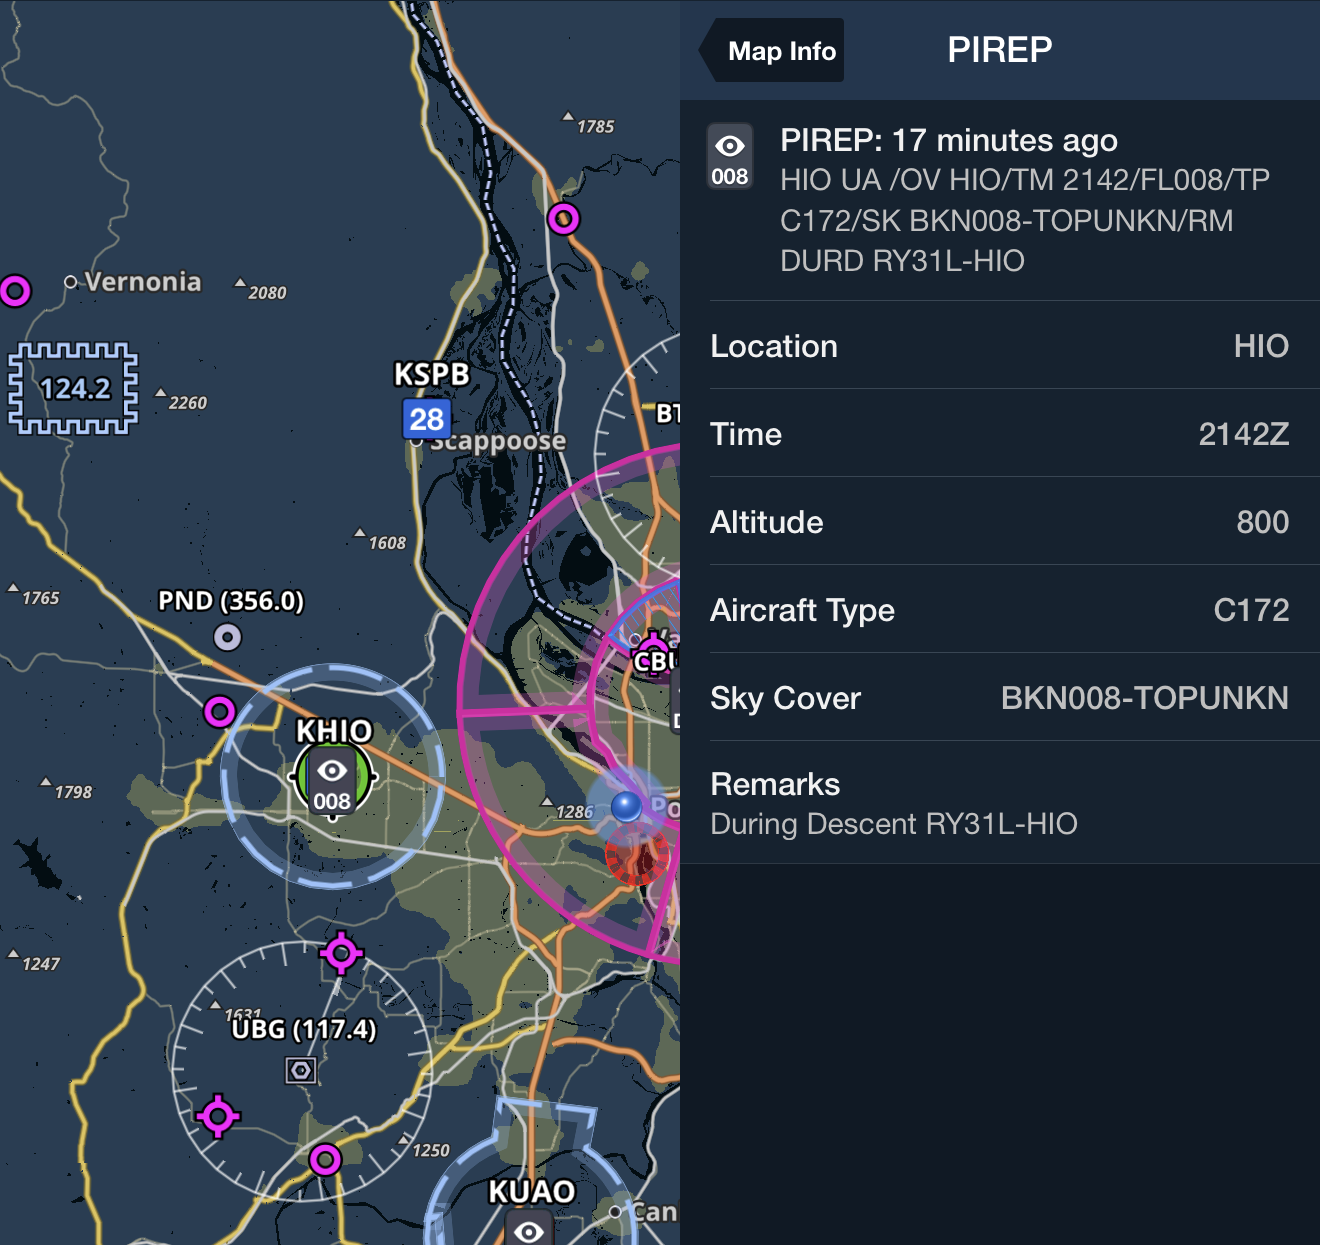
- Volunteered observations of in-flight conditions
- Two types: Routine (UA) and Urgent (UUA)
- UUA required for tornadoes, severe icing/turbulence, hail, and LLWS ±10 knots
- Elements include:
- /OV (location)
- /TM (time)
- /FL (altitude)
- /TP (aircraft type)
- /WX (weather)
- /TB (turbulence)
- /IC (icing)
Making a PIREP
- Who: Tailnumber and type, if needed
- Where: Relative to an airport or NAVAID
- When: Zulu time of the report
- What: One or more of the following
- Clouds
- Cloud Type
- Stratus
- Cumulus
- Towering Cumulus
- Cirrus
- Cumulonimbus
- Cloud Coverage
- Clear: no coverage
- Few: >0 to 2/8 coverage
- Scattered: 3/8 to 4/8 coverage
- Broken: 5/8 to 7/8 coverage
- Overcast: 8/8 coverage
- Cloud Type
- Turbulence (See Pilot-Controller Glossary T)
- Light: Momentarily causes slight, erratic changes in altitude and/or attitude.
- Light Chop: Slight, rapid, and somewhat rhythmic bumpiness without appreciable change in altitude or attitude. Occupants feel a slight strain against their seatbelts.
- Moderate: Changes in altitude and/or attitude occur but the aircraft remains in positive control. It usually causes variations in indicated airspeed.
- Moderate Chop: Causes rapid bumps or jolts without appreciable changes in altitude or attitude. Occupants feel a definite strain against their seatbelts, and unsecured objects will be dislodged.
- Severe: Causes large, abrupt changes in altitude and/or attitude. It usually causes large variations in indicated airspeed and the aircraft may be momentarily out of control. Occupants are violently forced against their seatbelts, and unsecured objects are tossed throughout the cabin.
- Extreme: Aircraft is violently tossed about and is practically impossible to control. It may cause structural damage.
- Icing (AIM 7-1-19)
- Trace: Ice is just becoming noticeable; accumulation slightly exceeds sublimation. Can be managed for longer periods but still requires monitoring
- Light: Occasional use of deicing systems is needed. Can be hazardous for an hour or more
- Moderate: Continuous use of ice protection systems is needed. Diversion or exit from icing conditions
- Severe: Ice protection systems cannot remove faster than accumulation. Immediate exit from icing conditions is required
- Visibility and type of precipitation
- Clouds
Radar Observations
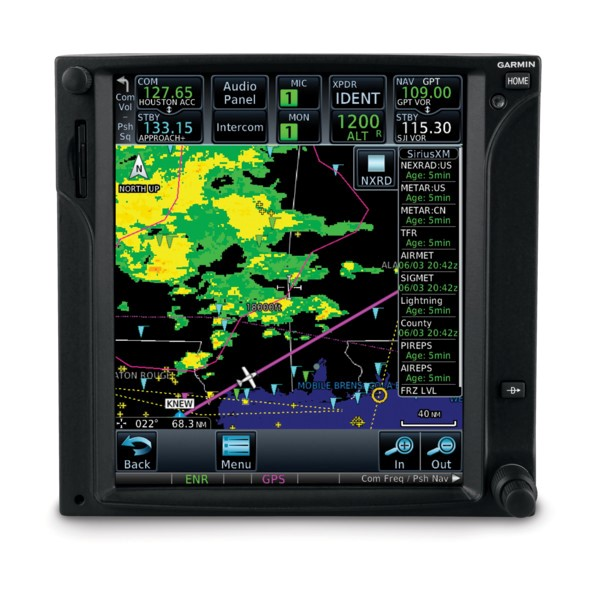
- Primary tool for detecting coverage, intensity, and movement of precipitation
- WSR-88D (NEXRAD) network updated every 4–10 minutes
- Intensity levels:
- LIGHT
- MODERATE
- HEAVY
- EXTREME
- Radar cannot detect clouds, fog, or turbulence directly
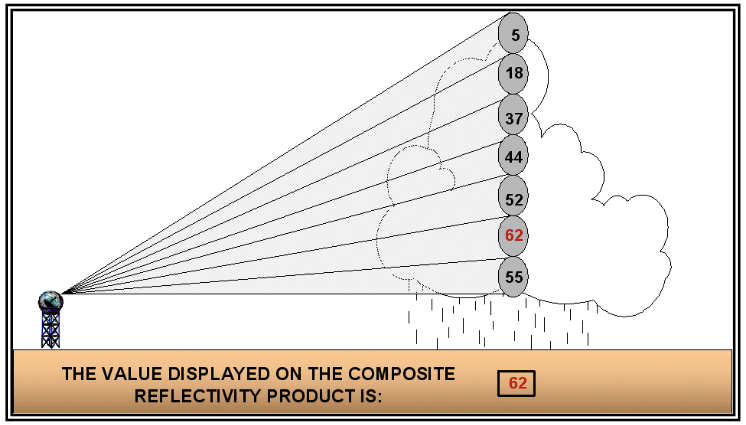
- Composite Reflectivity displays maximum intensity found in a vertical column (default Radar layer in ForeFlight)
- Base Reflectivity displays lowest elevation angle scan, or 0.5° above the horizon (also called "lowest tilt")
- Think of this as surface precipitation
- Datalinked radar mosaics may have a latency of 15–20 minutes
- Beware of NEXRAD data displayed in the cockpit
- Never navigate close to a thunderstorm using NEXRAD radar imagery
Surface Analysis Chart
- Computer-prepared analysis transmitted every 3 hours
- Depicts pressure systems, fronts, and station models
- Plotted Sea Level Pressure (SLP) uses 3 digits (tens, units, tenths)
- Station models show wind, temperature, dewpoint, sky cover, and present weather
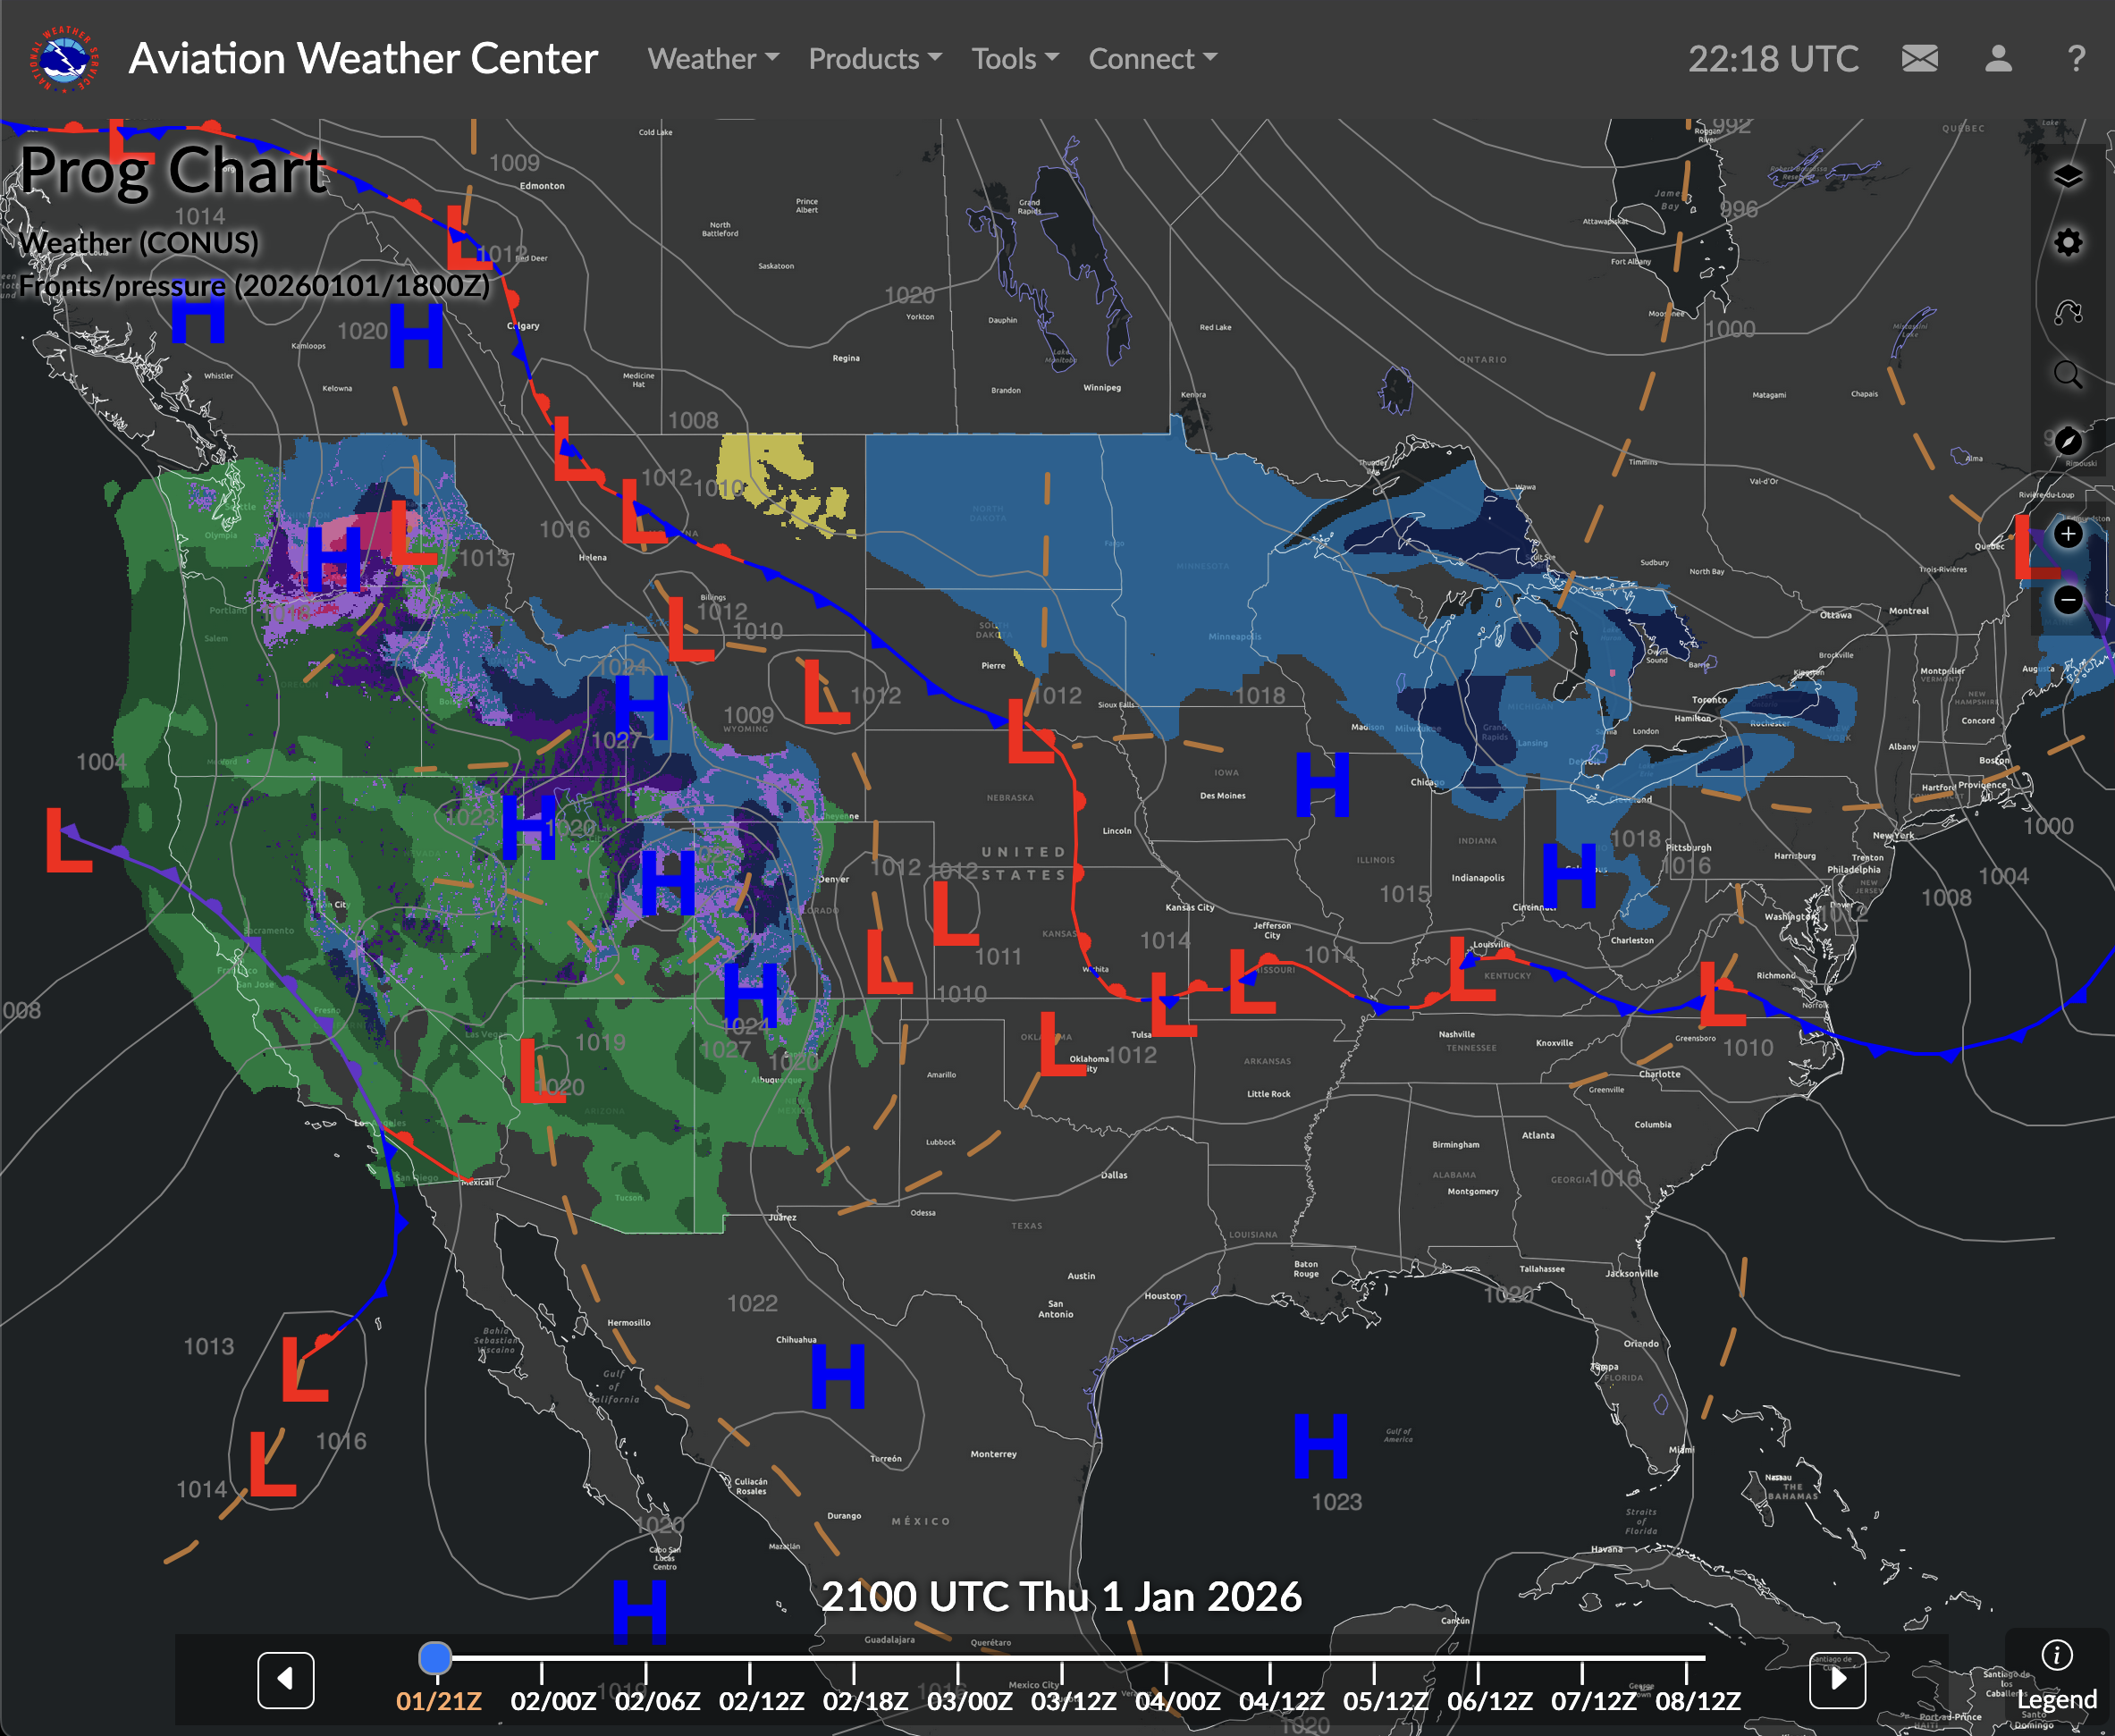
Significant Weather Prognostic Charts
- Provides "snapshots" of forecast weather over large areas
- Low-Level Chart covers SFC to FL240 at 12 and 24 hour intervals
- Mid-Level Chart covers 10,000 ft to FL450
- High-Level Chart covers FL250 to FL630
- Depicts flying categories (IFR, MVFR, VFR), turbulence, and freezing levels
- Depicts jet streams, CB cloud areas, and tropopause heights
- Isobars depict lines of equal pressure, typically at 4 MB intervals
Freezing Level Chart
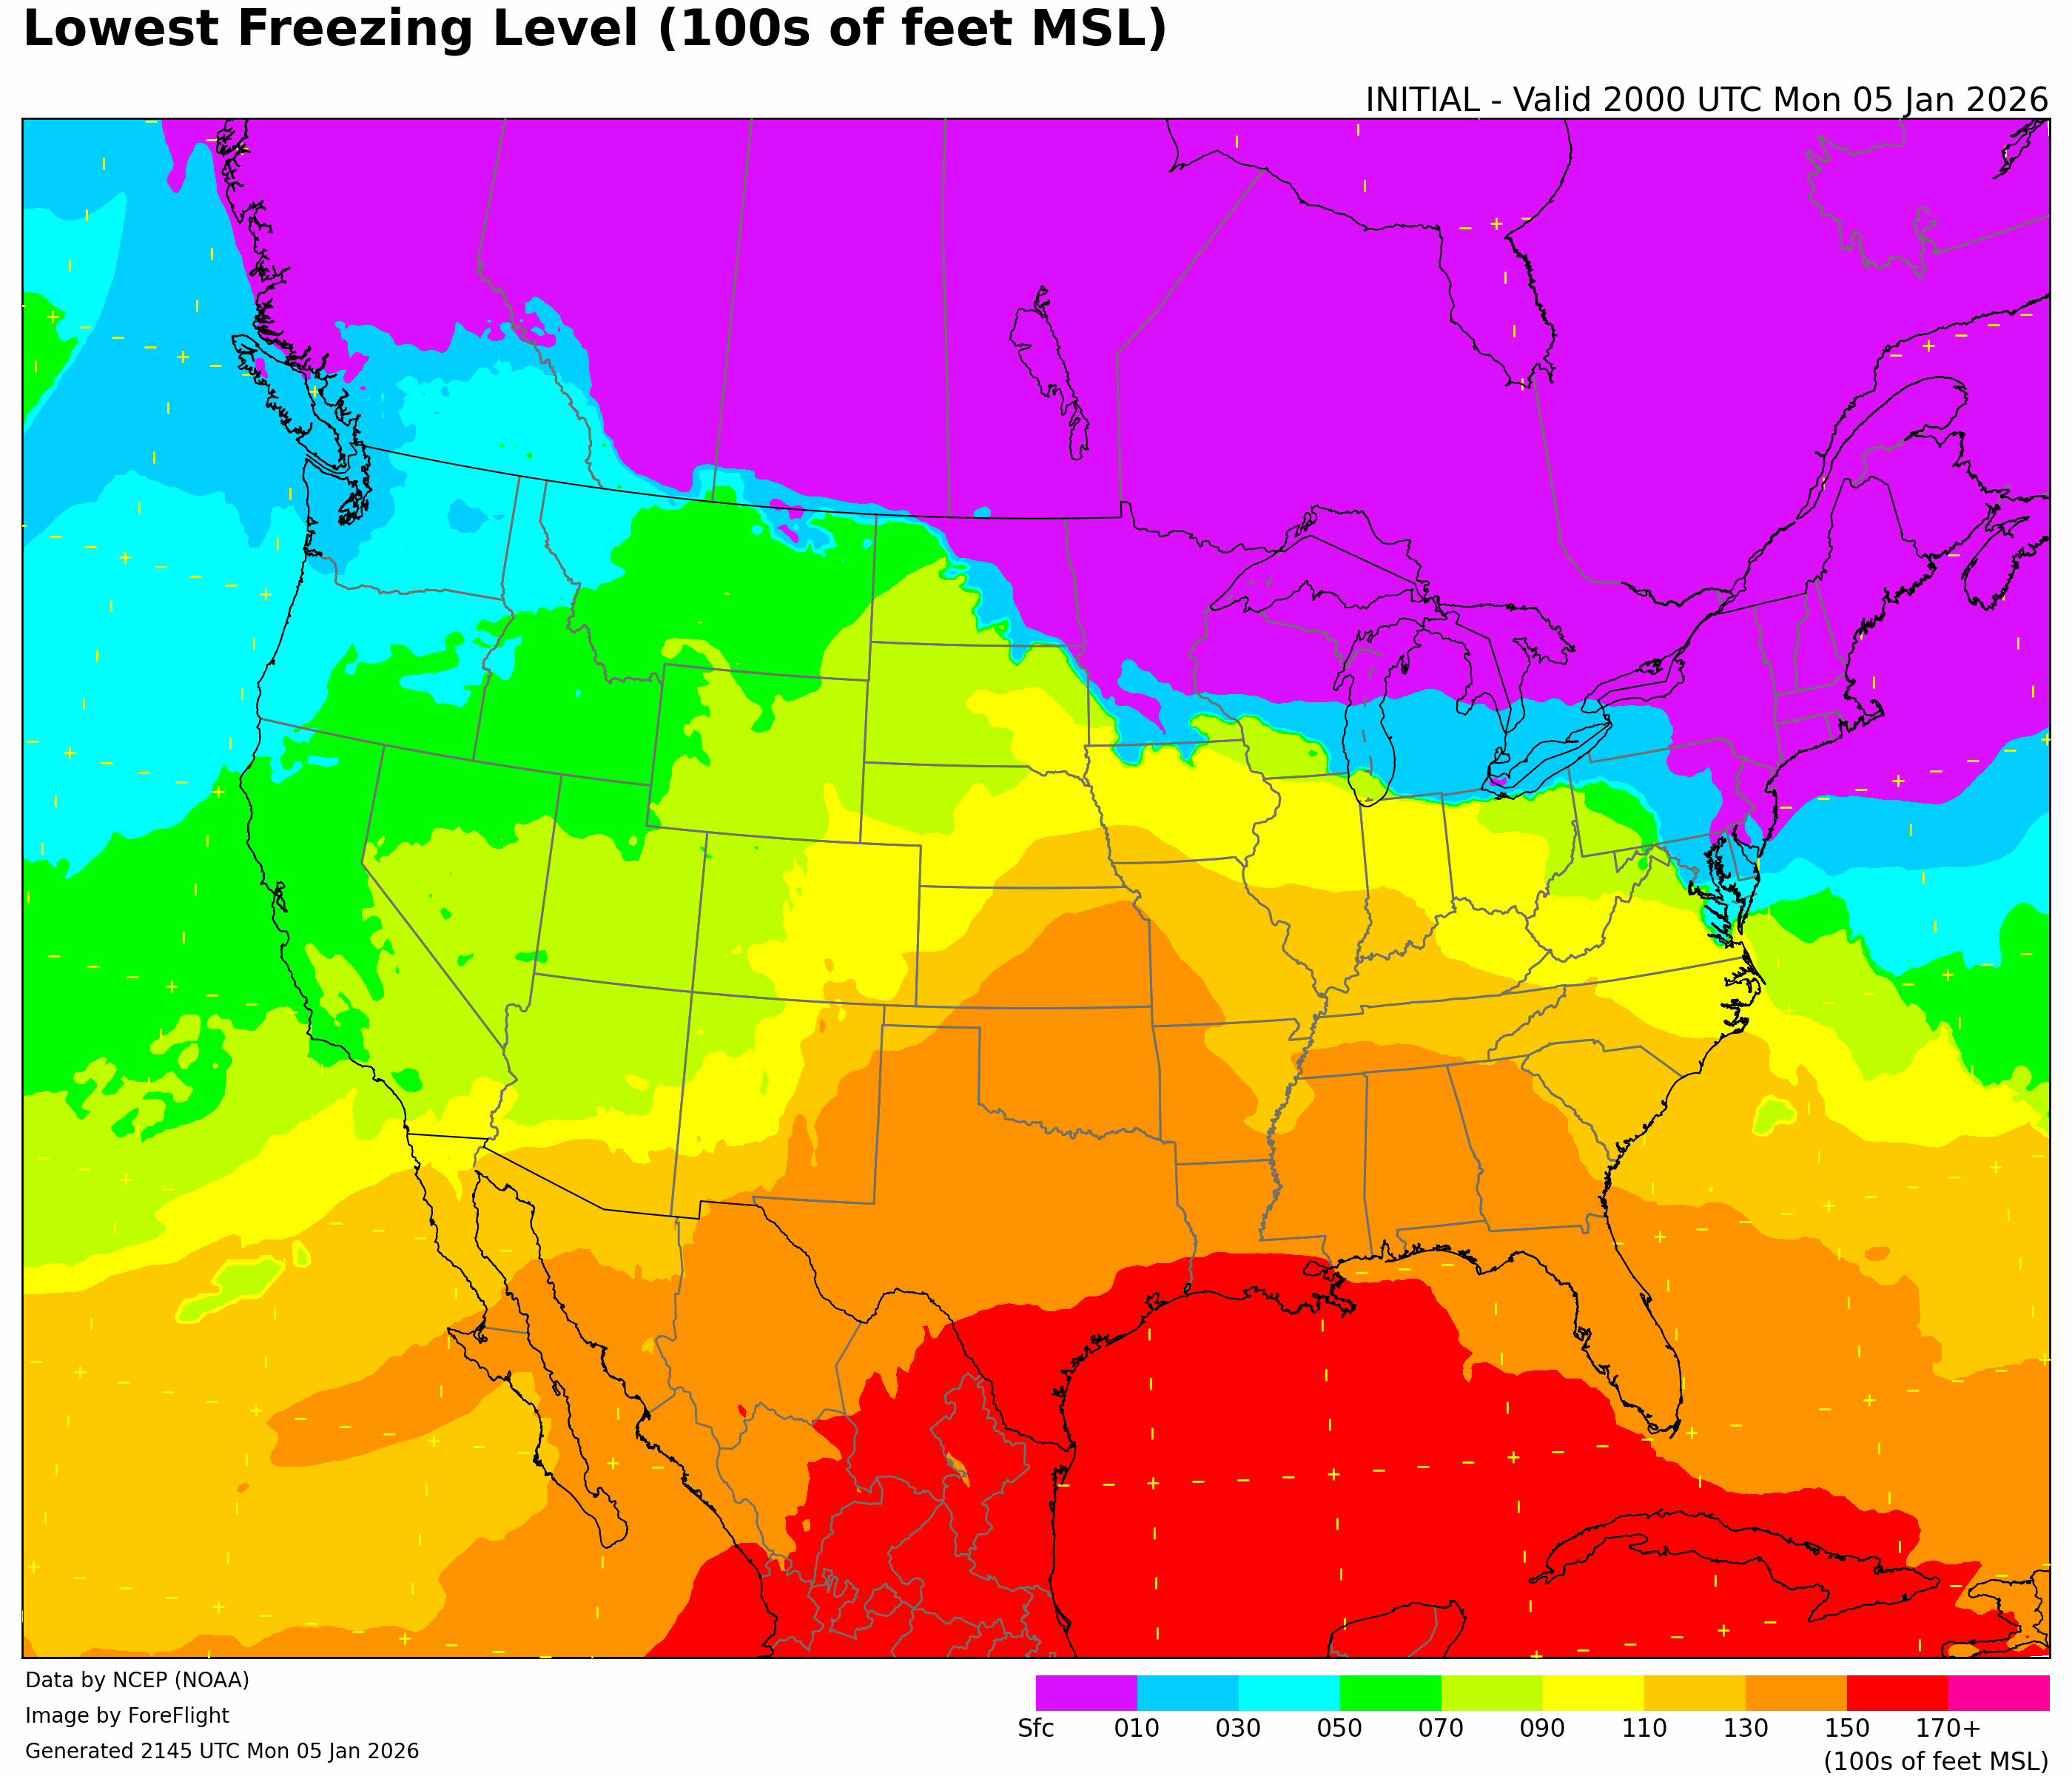
- No longer published by AWC, but generated by ForeFlight
- Analyzes the height of the lowest freezing level in hundreds of feet MSL
- Supplements forecast information in AIRMET Zulu
- Color-coded graphics used to assess icing risks
- Updated to help pilots avoid clear, rime, and mixed icing
SIGMETs, AIRMETs, and Convective SIGMETs
AIRMET (WA)
Advisories for phenomena hazardous to light aircraft, issued every 6 hours
- SIERRA: IFR and mountain obscuration
- Ceilings less than 1000' and/or visibility less than 3 SM, affecting over 50% of the area at one time
- TANGO: Turbulence
- Moderate turbulence
- Sustained surface winds of 30 knots or more at the surface
- ZULU: Icing
- Moderate icing
- Low freezing levels
SIGMET (WS)
Non-convective hazards to all aircraft
- Criteria:
- Severe turbulence
- Severe icing (not associated with a thunderstorm)
- Duststorms and sandstorms
- Volcanic ash
- A SIGMET is "widespread" in that it covers an area of at least 3,000 square miles
- Valid for 4 hours (6 for hurricanes/volcanic ash)
Convective SIGMET (WST)
Issued for hazardous convective activity
- Criteria:
- Surface winds ≥50 kt
- Thunderstorms with heavy precipitation, affecting ≥40% of an area >3,000 square miles
- Hail ≥3/4 inch
- And/or tornadoes
- Implies severe turbulence, severe icing, and low-level wind shear
- Issued hourly at H+55 and valid for up to 2 hours
Recognition of Critical Weather Situations
- Identify hazards like thunderstorms, icing, and windshear through chart interpretation
- Monitor in-flight resources: FSS, ATC, FIS-B, and PIREPs
- Watch for small temperature/dewpoint spreads indicating potential fog
- Analyze stability indices (LI and K Index) on charts to predict convection
- Constant reevaluation of the go/no-go decision based on actual vs. forecast conditions
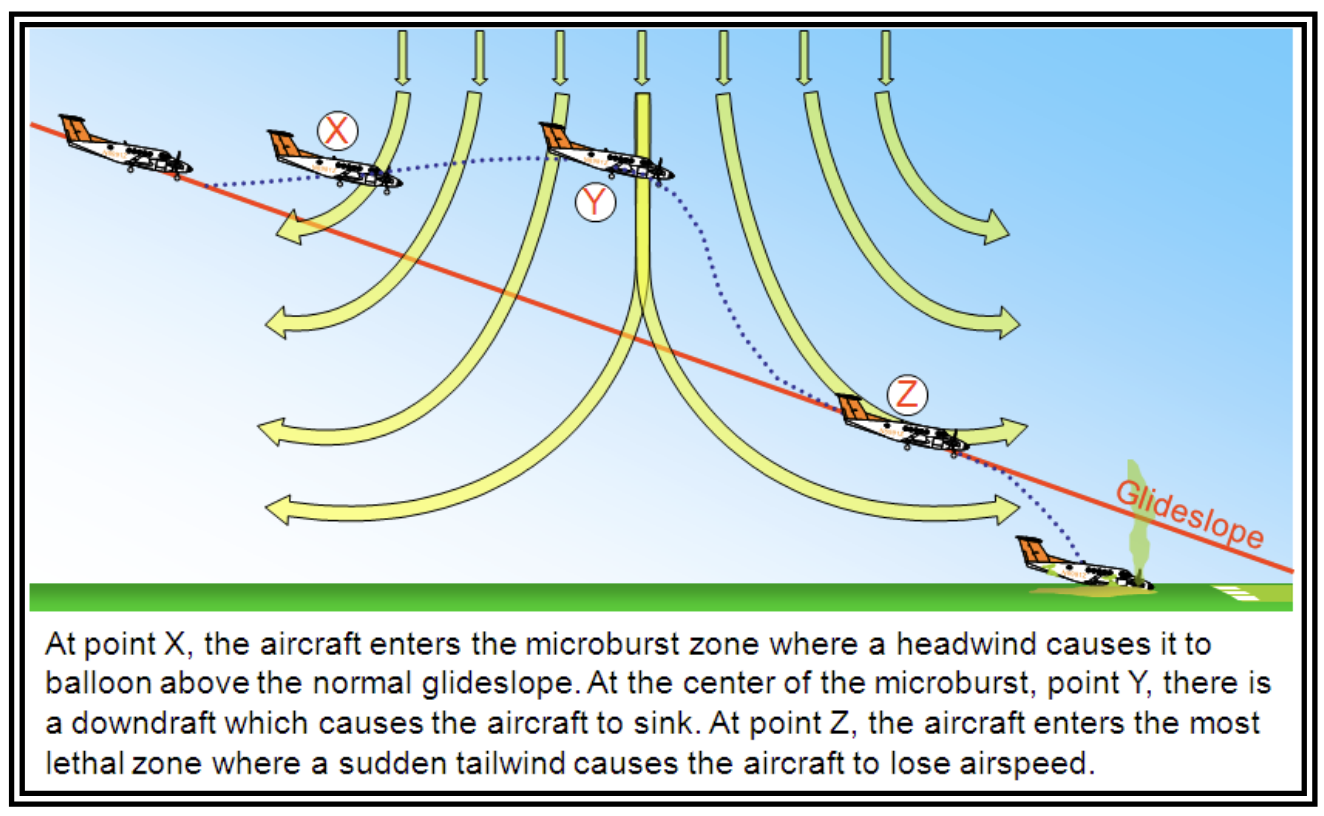
Windshear Avoidance
- Sudden, drastic change in wind speed and/or direction
- Associated with thunderstorms, fronts, and temperature inversions
- Avoid thunderstorms by at least 20 miles due to potential severe turbulence
- A Microburst can produce headwind losses of 30–90 knots
References
- Aviation Weather Handbook: 3-7 to 3-12, 24-5 to 24-25, 26-2 to 26-21, 27-3 to 27-58
- Instrument Flying Handbook: 2-11, 10-22 to 10-25
- Instrument Procedures Handbook: 4-2 to 4-7
- Aeronautical Information Manual: 7-1-3, 7-1-5, 7-1-26
- Pilot-Controller Glossary: 2137, 2151, 2174, 2180, 2318
- Backseat Pilot CFII Lesson Plans: III.A (Weather Information)
- AOPA PIREP Safety Spotlight