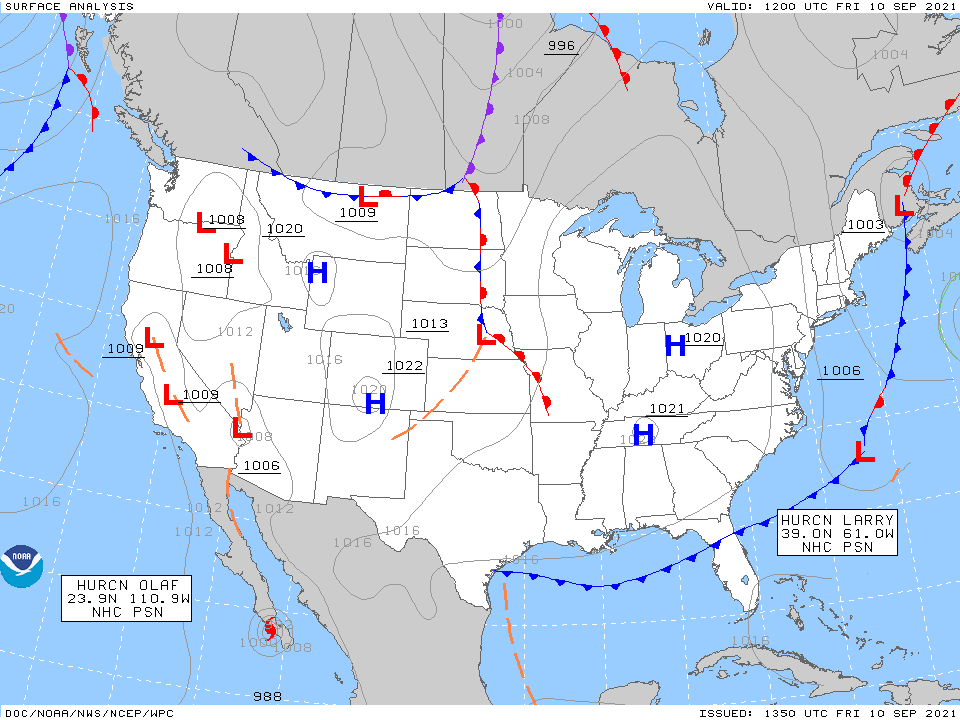
Surface Analysis Charts
Surface analysis charts are analyzed charts of surface weather observations. The chart depicts the distribution of several items, including sea-level pressure; the positions of highs, lows, ridges, and troughs; the location and type of fronts; and the various boundaries such as drylines.
The Aviation Weather Center publishes the WPC Surface Prog Chart.
